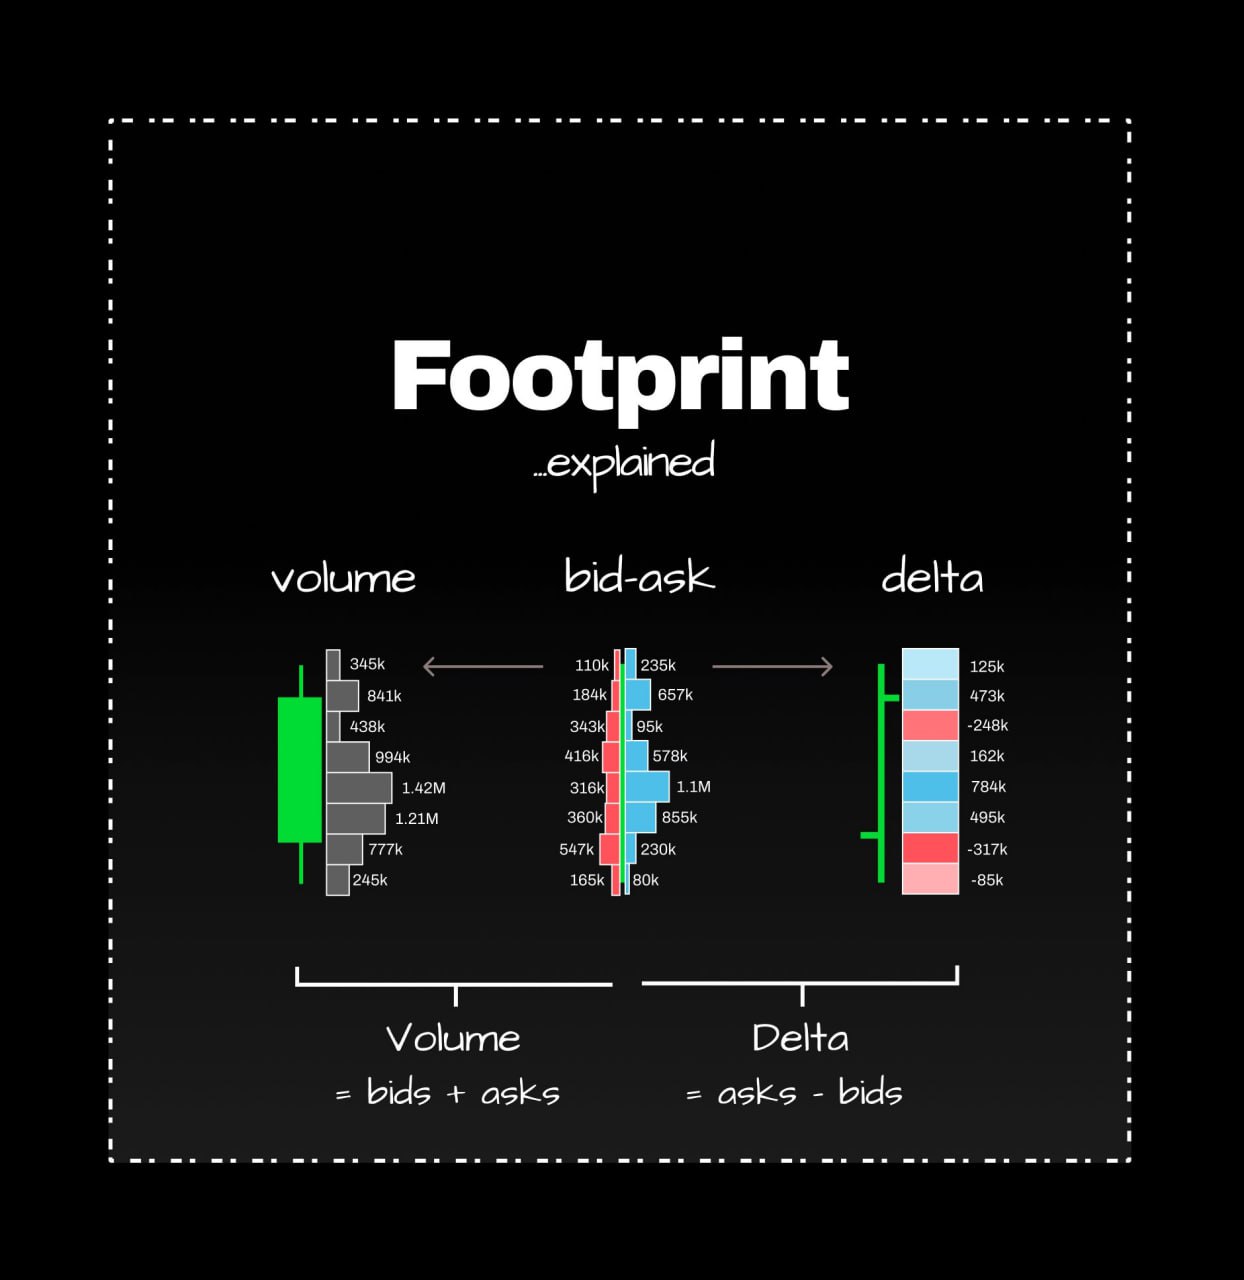
Understanding Footprint Charts in Trading
Footprint charts provide a unique perspective on market movements by revealing the actual order flow, indicating who is buying, who is selling, and where the activity is concentrated.
Key Points:
- They display bid versus ask volume at different price levels.
- Footprints can be interpreted as volume clusters, profiles, or deltas.
- Useful in identifying absorptions, imbalances, and trapped traders within the market.
- Help uncover the true intent driving price actions, beyond just the movement itself.
Footprint charts offer insights into not just the price action but also the underlying dynamics that led to those price movements.
You’ll love this too: Bitcoin’s Projected Price Range: $160,000 – $170,000