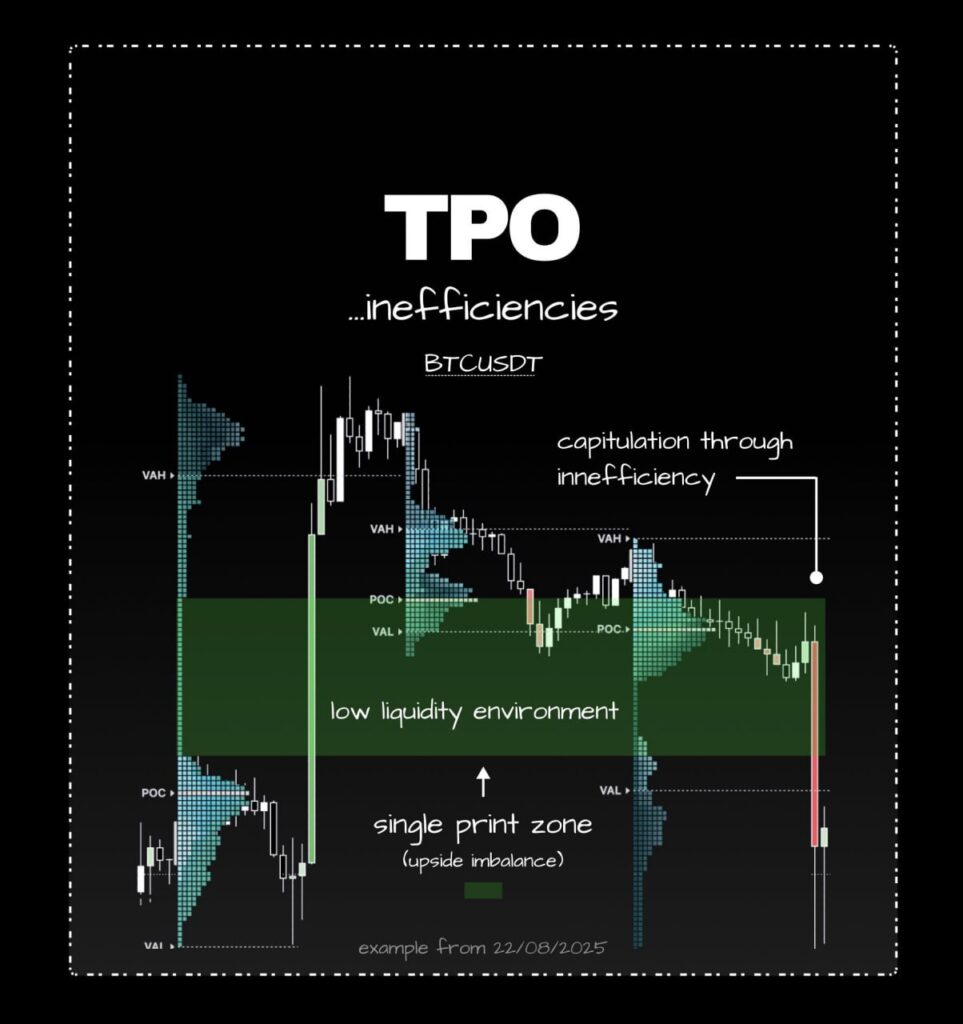
TPO Inefficiencies: Understanding Price Movements
Fast vertical movements in trading often result in thin auctions on the Time Price Opportunity (TPO) chart, appearing as single prints with minimal overlap. These single print zones create low-liquidity corridors that allow prices to move rapidly.
Identifying and Utilizing Single Print Zones
When analyzing recent trading sessions, mark the single print zones as they act as air pockets until fully traded. Re-entering these zones typically leads to quick and smooth price movements towards the opposite edge.
Look for confluence between single print zones and other factors like price gaps, imbalance candles, or market news. The more confluence present, the more reliable the subsequent price movement.
Anchor your trading decisions using Value Area High (VAH), Value Area Low (VAL), and Point of Control (POC) within these zones. Avoid initiating new trades within the middle of a single print zone to minimize risks.
As the single print zone gets filled and trading volume increases, the initial inefficiency dissipates, returning the market to a more normal trading environment.
Using TPO for Strategic Trading
It’s essential to understand that TPO does not indicate price direction but highlights areas where price acceleration is likely. By incorporating these zones into your analysis, you can gain valuable context, anticipate the path of least resistance, and let the market dynamics guide your trading decisions effectively.
You’ll love this too: Ethena Fee Switch Activation: Key Conditions & Value Unlocking