Understanding Footprint Charts in Trading: Key Insights and Benefits
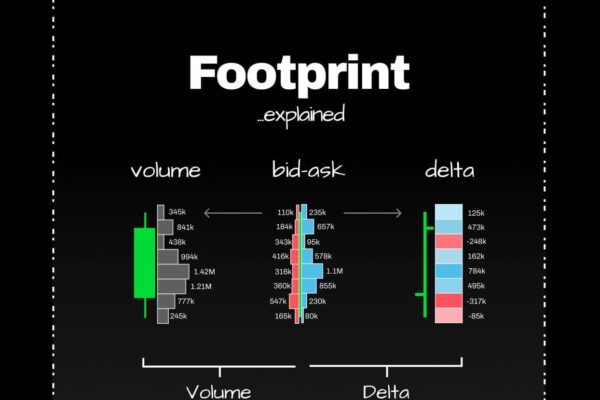
Understanding Footprint Charts in Trading Footprint charts provide a unique perspective on market movements by revealing the actual order flow, indicating who is buying, who is selling, and where the activity is concentrated. Key Points: They display bid versus ask volume at different price levels. Footprints can be interpreted as volume clusters, profiles, or deltas….