Liquidation Heatmaps: A Practical Guide
Understanding liquidation heatmaps goes beyond just interpreting candlestick patterns. These visual tools provide insights into market dynamics by pinpointing areas of significant market activity and potential price movements.
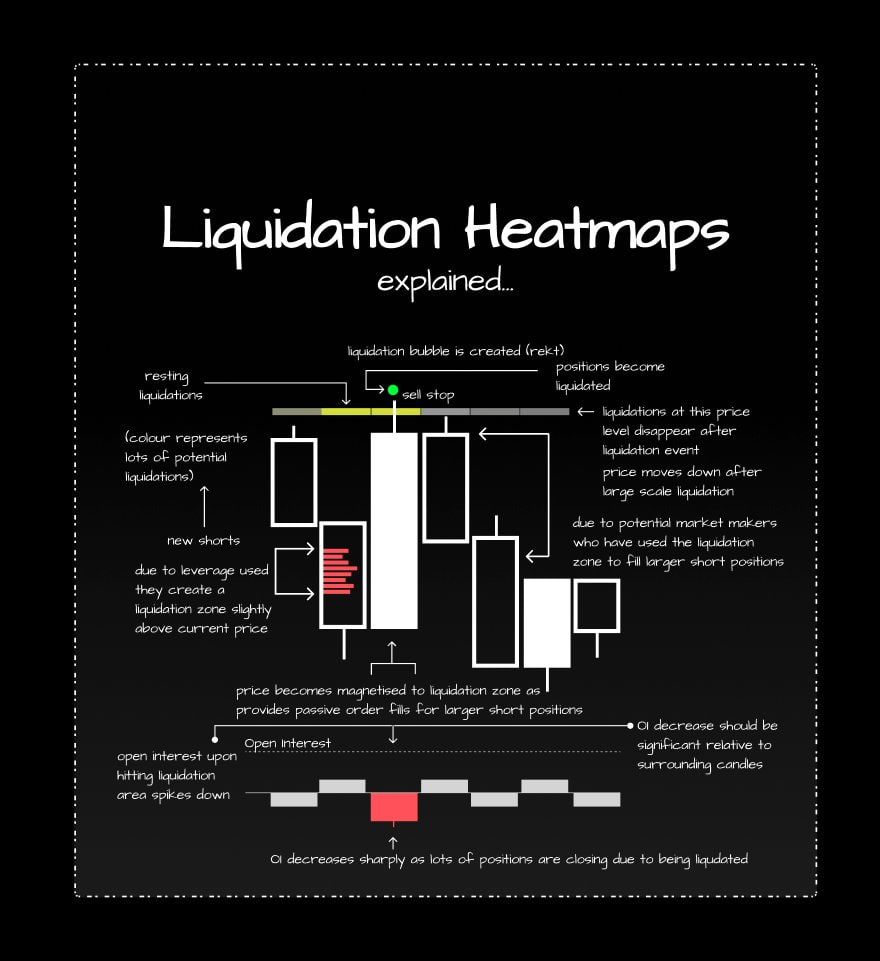
Key takeaways from utilizing liquidation heatmaps:
- Bright Zones: Highlight clusters of stop-loss orders and liquidations.
- Price Magnetization: Prices tend to gravitate towards these zones, triggering liquidity events.
- Volatility and Direction: Following a sweep, expect increased volatility and possible trend reversals.
- Open Interest Analysis: A sharp drop in open interest validates genuine liquidation activities amidst market noise.
- Strategic Planning: Use heatmaps to strategically plan entry points around liquidation zones rather than within them.
The Role of Heatmaps
It’s essential to note that liquidation heatmaps do not predict future price movements. Instead, they offer valuable insights into where market activities are concentrated, aiding traders in making informed decisions.
Also read: Whales Accumulate $115M of ETH from FalconX – Institutional Accumulation